
Troubled Waters
Industrial Pollution Still Threatens America's Waterways
Over a 21-month period from January 2016 to September 2017, major industrial facilities released pollution that exceeded the levels allowed under their Clean Water Act permits more than 8,100 times. Often, these polluters faced no fines or penalties.
Downloads
America’s waterways provide us with drinking water, places to fish and swim, and critical habitat for wildlife – when they are clean and protected.
The passage of the Clean Water Act in 1972 was a turning point in America’s efforts to protect and restore its rivers, lakes and coastal waters. Though the Clean Water Act has made some progress bringing our waters back to health, a closer look at compliance with and enforcement of the law reveals an overly lenient system that too often allows pollution without accountability.
Over a 21-month period from January 2016 to September 2017, major industrial facilities released pollution that exceeded the levels allowed under their Clean Water Act permits more than 8,100 times. Often, these polluters faced no fines or penalties.
To protect and restore our waters, state and federal officials must tighten enforcement of the Clean Water Act.
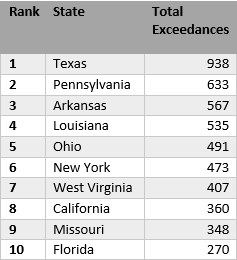
Table ES-1. The 10 States with the Most Exceedances Reported by Major Industrial Facilities
National data on Clean Water Act compliance shows that during the 21-month span from January 2016 through September 2017:[1]
-
The nation’s major industrial facilities discharged pollution in excess of their permits at least 8,148 times.
-
During roughly one-third of exceedances – more than 2,600 times in total – pollutants were being added to waters that were already too polluted for uses such as recreation, fishing or drinking water, hindering efforts to restore them.
-
Approximately 40 percent of all major industrial facilities – more than 1,100 in total – reported exceeding their pollution limits at least once.
-
Three-quarters of facilities that exceeded their discharge permit limits did so more than once.
Not only did many major industrial facilities exceed their permit limits – sometimes frequently – but some of those exceedances were particularly severe, with facilities releasing multiple times the amount of pollution permitted under their Clean Water Act permits.
State and federal agencies are failing to take strong enforcement action to stop these rampant excess discharges of pollution into America’s waters.
-
Numerous studies by the EPA Inspector General and others highlight a history of lackluster enforcement of the Clean Water Act by state environmental agencies.
-
The number of inspections of major industrial facilities was on pace to be lower in 2017 than in any of the previous five years, according to Integrated Compliance Information System (ICIS) records (Figure ES-1).
Figure ES-1. Federal and State Inspections of Industrial Facilities by Year

-
Many violations go unpunished. Each year from 2011 to 2017, an average of 27,849 facilities were non-compliant across the U.S., while an average of 13,076 – less than half – faced any EPA or state enforcement action.[2]
-
Even when fines are issued, they are often too low to deter polluters. In 2017, the median fine issued by the EPA was lower than it had been in any year since 2011.[3]
The Trump administration’s proposed cuts to the Environmental Protection Agency’s budget and reduced emphasis on enforcement threaten to open the door for more illegal pollution of our waterways. For fiscal year 2019, the current administration plans to cut the EPA’s budget for civil enforcement of environmental protection programs, including the Clean Water Act, by $30.4 million.[4] Funding for state grants to improve the permitting process and enforcement of the Clean Water Act is slated for cuts as well; this program’s proposed budget is lower than the amount allotted in total grants for at least the previous seven years.[5]
To protect the rivers, streams and lakes that are critical for the health of our wildlife and our communities, states and the federal government need to take strong action to enforce our core environmental laws. To strengthen compliance with clean water regulations, policymakers should:
-
Ensure that the Clean Water Act applies to all our waterways, so that there is nowhere polluters can dump with impunity.
-
Strengthen permits with enforceable, numeric limits on pollution that are ratcheted down over time as technology allows or water quality demands.
-
Restore – and increase – funding for state and federal enforcement, such as water pollution control grants, so that states have the resources to improve the efficacy of their clean water programs.
-
Issue timely penalties that are sufficiently high to deter companies from polluting our waters.
-
Boost compliance and enforcement by increasing the number of on-site inspections at major facilities.
-
Guard against any weakening of citizens’ ability to enforce pollution limits in court when state and federal authorities fail to halt illegal dumping.
In addition:
-
States that repeatedly fail to enforce the Clean Water Act should face consequences for their inaction – including loss of federal funding and/or primary enforcement authority.
-
Companies should reduce their use of toxic chemicals and adopt other innovations to minimize the generation of pollution in the first place.
[1] This analysis excludes the state of New Jersey because its data are not in the federal Integrated Compliance Information System database.
[2] The annual number of non-compliant facilities was found by adding non-compliant minor facilities and non-compliant major facilities for each year, then averaging the total, and the annual number of EPA and state enforcement actions was found by adding EPA formal actions, EPA informal actions, state formal actions and state informal actions for each year, then averaging the total. Data downloaded from the EPA ECHO State Water Dashboard, accessed 21 February 2018 at https://echo.epa.gov/trends/comparative-maps-dashboards/state-water-dashboard.
[3] Data downloaded from the EPA ECHO State Water Dashboard, accessed 3 February 2018 at https://echo.epa.gov/trends/comparative-maps-dashboards/state-water-dashboard.